- Analisis
- Analisis teknis
GBP/USD Analisis teknis - GBP/USD Jual beli: 2020-10-08
GBP/USD Technical Analysis Summary
Atas 1.301
Buy Stop
Bawah 1.266
Stop Loss
| Indicator | Signal |
| RSI | Buy |
| MACD | Buy |
| MA(200) | Neutral |
| Fractals | Neutral |
| Parabolic SAR | Buy |
| Bollinger Bands | Neutral |
GBP/USD Chart Analysis
GBP/USD Analisis Teknis
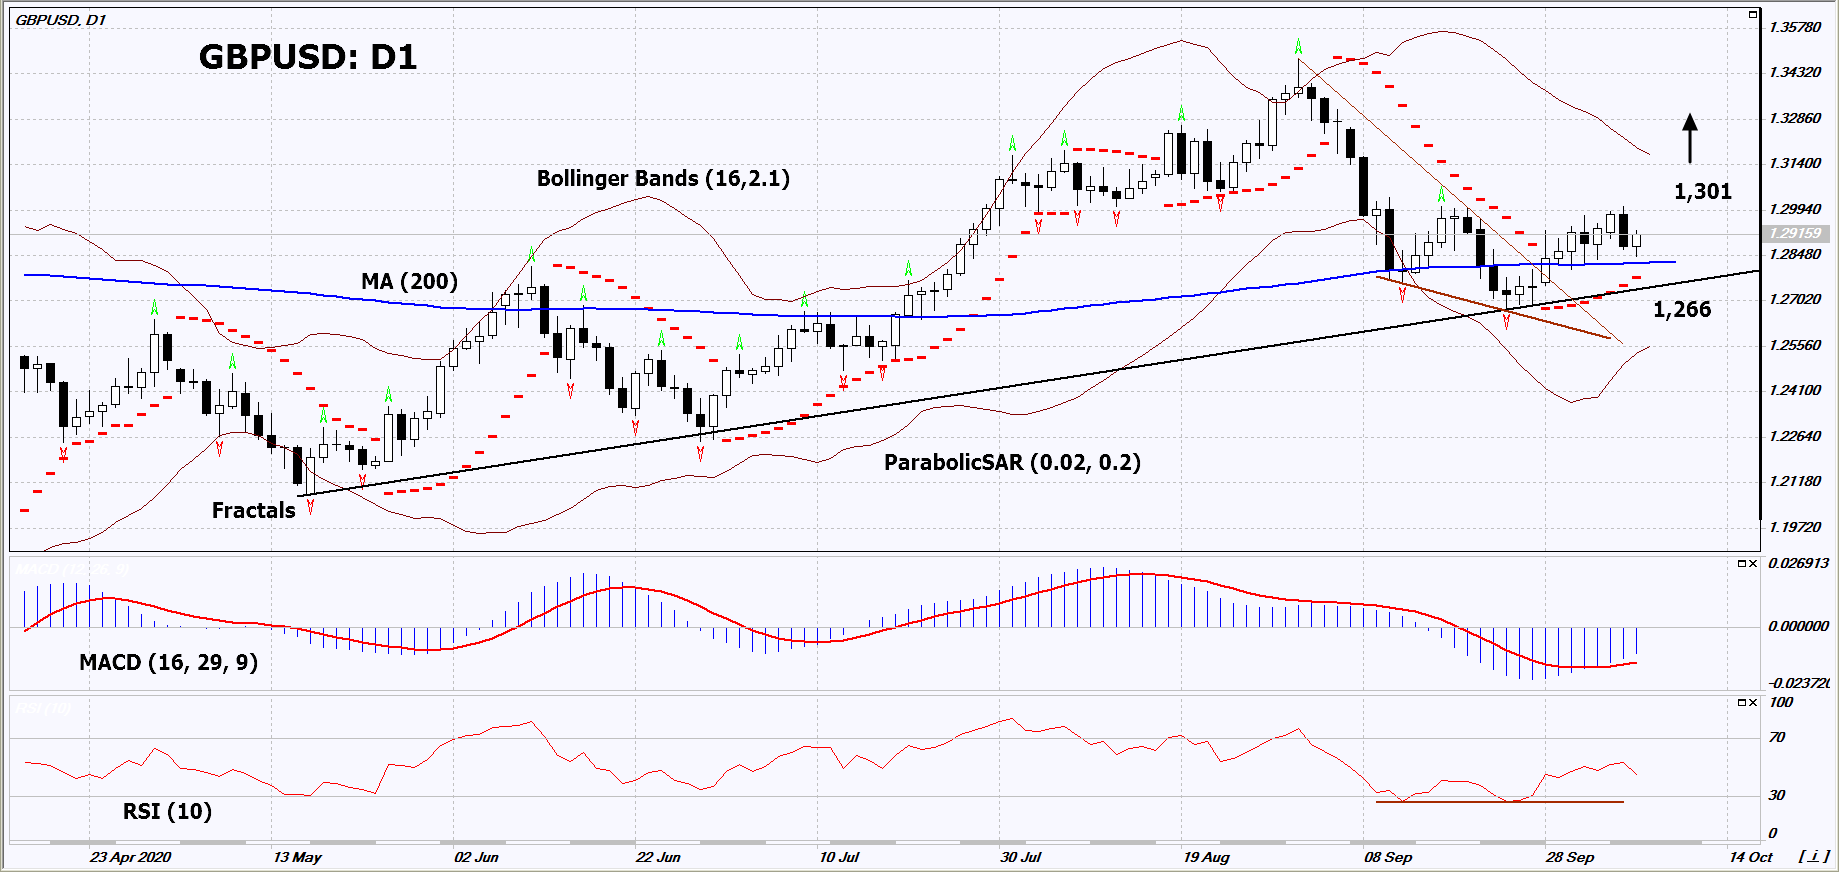
On the daily timeframe, GBPUSD: D1 tested the uptrend support line for the third time and is trying to move upwards. A number of technical analysis indicators formed signals for further growth. We do not exclude a bullish move if GBPUSD rises above the last upper fractal: 1.301. This level can be used as an entry point. We can place a stop loss below the 200-day moving average line, the Parabolic signal and the last lower fractal: 1.266. After opening a pending order, we move the stop loss to the next fractal low following the Bollinger and Parabolic signals. Thus, we change the potential profit/loss ratio in our favor. After the transaction, the most risk-averse traders can switch to the four-hour chart and set a stop loss, moving it in the direction of the bias. If the price meets the stop loss (1.266) without activating the order (1.301), it is recommended to delete the order:some internal changes in the market have not been taken into account.
Fundamental Analysis Forex - GBP/USD
Brexit negotiations could be extended.Will the GBPUSD quotes grow?
The upward movement means the strengthening of the British pound. The transition period during which Britain remains in the European Union should end on January 1, 2021. The agreement governing the Brexit terms was to be signed at the EU summit on October 15-16. On October 1, the European Commission notified Britain of a violation of European law and obligations under the Brexit agreement. Thus, the negotiations can be extended until November 1 and beyond. German Foreign Minister Heiko Maas says the coronavirus pandemic is negatively affecting the Brexit negotiations. The British pound rate may be supported by positive economic indicators of Construction PMI and Markit / CIPS Composite PMI. Important August data will be published in Britain on October 9: GDP, trade balance and industrial production.
Perhatian:
Tinjauan ini memiliki karakter informatif dan tutorial dan dipublikasikan secara gratis. Semua data, termasuk dalam Tinjauan, diterima dari sumber publik, diakui kurang lebih dapat diandalkan. Apalagi, tidak ada jaminan bahwa informasi yang ditunjukkan penuh dan tepat. tinjauan tidak diperbarui. Keseluruhan informasi dalam setiap tinjauan, termasuk pendapat, indikator, grafik dan hal lainnya, disediakan hanya untuk tujuan pengenalan dan bukan saran keuangan atau rekomendasi. Seluruh teks dan bagiannya, serta grafik tidak dapat dianggap sebagai tawaran untuk membuat kesepakatan dengan aset apa pun. Pasar IFC dan karyawannya dalam kondisi apapun tidak bertanggung jawab atas tindakan yang dilakukan oleh orang lain selama atau setelah membaca tinjauan.


