- Inovasi
- Artikel Aplikasi PCI
- Perdagangan Spread
Comparing the performance of German stock market versus US stock market
Predictions on Stock Markets
Currently, the world's main stock indices move roughly identically. The S&P500, DJI and Nasdaq 100 have fallen by about 8.5% since the beginning of 2016. The German stock index DAX in dollar value has dropped by 9.4% and the British FTSE 100 almost did by the same way. Since the beginning of this year the 7% decline of the French CAC 40 index was the smallest, while the Japanese Nikkei 225 recorded the biggest loss – 10.7%. All the changes are in dollar value and they take into account the dynamics of the national currencies.
Evidently, no fundamental differences between performances of indices have been observed yet. However, we may expect they will appear in the course of this year because of the differences in monetary policies of the central banks. The Federal Reserve of the United States has repeatedly announced about the plans to tighten and for the first time in 10 years has even raised the federal funds rate from 0.125% to 0.375% at the last meeting on December 16, 2015. It is expected that during 2016 the rate will be increased by 1 percentage point. This can have a negative impact on the financial indicators of the US corporations because of the increased debt pressure and the possible strengthening of the US dollar.
The European Central Bank and the Bank of Japan are currently conducting easy monetary policy. They are buying different types of bonds and other securities through a monetary emission and keep an extremely low level of interest rates. It may be assumed that such a “credit pumping” and actual debt restructuring will contribute to the improvement of financial conditions of the companies of these countries. As a result, such macroeconomic processes can impact the stock prices and dynamics of stock market indexes. At the same time, the shares of companies from the European Union, Japan and Great Britain may gain more than their American competitors. You can see the example of Japanese and US market comparison analysis made by analysts of IFC Markets.
Comparing the Markets through PCI Technology
Ever wondered how to easily determine whether investments in a particular foreign stock market outperformed investments in US stocks? There is an ideal instrument which lets you do that – the Personal Composite Instrument (PCI) based on PQM Method.
To make that comparison, you just need to download the NetTradeX trading platform, open a demo or real account. Afterwards, you will get access to the PCI technology and hence, will be able to create a cross-rate of stock indexes of equity markets you are interested in and make a comparison. It is very easy and straightforward.
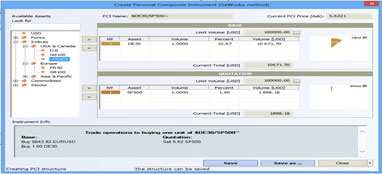
Once the NetTradeX platform is installed and running, create a PCI with the DE 30 and the SP500 - the CFDs on Germany’s and the US stock market indexes DAX30 and SP500, as the Base and Quote assets respectively. The simple steps for PCI creation are described at the webpage “How to create PCI”. It took us just 2 minutes to create this one.
With the structure of the PCI set as shown in the Figure 1 below, save the PCI by clicking the “Save” button (you have to just enter a name for it, we have called it &DAX30/SP500).

Figure 1: &DAX30/SP500 PCI
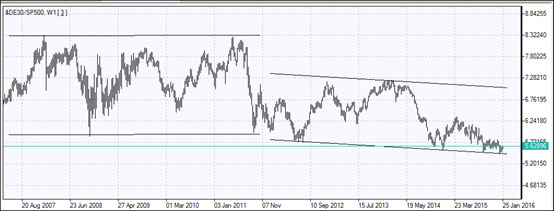
Then,you just need to add the newly created instrument to the used ones and open its chart to conduct an analysis and trade. The chart is presented below in Figure 2.

Figure 2: &DAX30/SP500 PCI Weekly Chart
Let us inspect the PCI chart, where channels are drawn to capture any trend in the price movement. The price of our PCI is equal to the ratio of the dollar values of the DAX30 index and the SP500 index. On the weekly candle chart the PCI price has moved sideways in the 2007-2011 period in a horizontal channel, and has been moving within a downward channel since 2011. Stated otherwise, the ratio of the DE 30 index to the SP500 index fluctuated within a range in 2007-2011 period, and has been on decline since 2011. This simply means that the German stock market index DAX30 has not outperformed the US broad stock market index SP500 yet. Furthermore, the SP500 has been outperforming the DAX30 since 2011. Thus, the DE 30/SP500 ratio, our PCI price,has been declining so far.
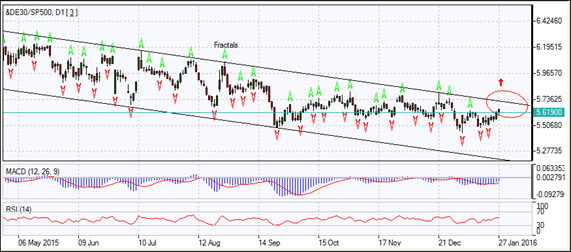
Now, we can use the PCI chart to see also if there are signs of a reversal of this trend, that is whether there are signs that the German stock market has started outperforming the US stock market. Let us switch to the daily candlestick chart and add the Williams’ fractals indicator, as well as the RSI and MACD indicators. The daily candlestick PCI chart is presented below in Figure 3.

Figure 3: &DAX30/SP500 PCI Daily Chart
As is evident from the chart, the PCI price is trading within a downward channel. But it has been rising toward the upper boundary of the channel in the last few sessions. The RSI indicator has crossed the 50 level and is rising. The MACD indicator is below the 0 level and the signal line, but the gap with the signal line is narrowing. This is a bullish signal, as is the RSI’s signal. This is indicated by the red up-arrow on the PCI chart. Now, if the price reaches the upper channel boundary in the region marked by the red oval, breaches the upper boundary and closes above it - this may indicate the start of a rising trend and the reversal of the downward trend. Hence, the start of the German stock market out performance over the US stock market will be indicated by the breach of the &DAX30/SP500 PCI price over the channel upper boundary and the development of a rising trend. So we have to monitor closely the daily PCI chart and use the breaching of the channel upper boundary as a signal that an upward trend is in development, which will mean that the DAX30 has started to outperform the SP500. And once confirmed that it was not a false breach, it can be used as a signal for going long on German stocks and short on US stocks.
Thus, a simple PCI with two stock market indexes can be used to analyze the relative performance of the stock markets and determine which market to invest in. Similarly, a PCI with specific base and quote portfolios from two stock markets can be used to analyze relative portfolio performance and determine which one to invest in.
Temukan manfaat perdagangan Forex & CFD dengan IFC Markets
- Mata uang | Saham | Indeks | Komoditas | Logam | ETF | Future Crypto
- Instrumen Komposit Peribadi (PCI)
- Spread tetap dan kecil
- Eksekusi instan
- Membuat & berdagang instrumen milik sendiri
- Memilih instrumen sintetis yang tersedia dari Pustaka PCI
- NetTradeX – platform perdagangan sendiri
- MT4, MT5 & WebTerminal yang terkenal
- Dukungan online terkualifikasi dalam 19 bahasa
- 24 jam sehari
Artikel sebelumnya
- Performance of Japanese stock market versus the US stock market
- Arbitrage Trading | FCATTLE/SOYB – Analisis Efisiensi
- PCI: Komoditas Berjangka - Kopi vs Kakao
- PCI Pertanian berjangka: Gandum berjangka dan Budidaya Ternak Sapi
- Laporan Perusahaan Baru – Saham Google, Saham Apple
- Penyebaran dari Trading | Saham Trading – Saham Google, Saham Apple
