- Edukasi
- Analisis teknis
- Indikator teknis
- Indikator tren
- Parabolik
Parabolic SAR – Indikator Parabolik
Cara Menggunakan Parabolic SAR
Saat menggunakan inikator, kita harus mempertimbangkan posisinya terhadap grafik harga serta faktor akselerasi beserta tren. Meskipun menjadi alat analisis terkenal, ini mempuyai batasan dan dapat memberikan sinyal pada kondisi pasar yang sering berubah.
Indikator dapat memberikan sinyal berikut ini:
Konfirmasi tren
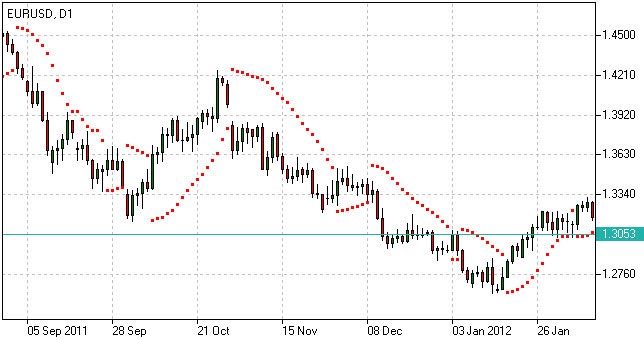
- Jika indikator diplot di bawah grafik harga, itu berlaku untuk uptrend;
- Jika indikator diplot di atas grafik harga, itu berlaku untuk downtrend.
Pennetuan titik keluar
- Jika harga jatuh di bawah garis Parabolik selama uptrend, mungkin merupakan pertanda pada penutupan posisi panjang;
- Jika harga naik di atas kurva Parabolik selama downtren, mungkin akan ada penutupan posisi pendek.
Signifikansi sinyal ditentukan dengan menggunakan faktor akselerasi. Faktor akselerasi bertambah tiap kali harga tutup lebih tinggi dari nilai sebelumnya dalam uptrend dan lebih rendah dalam downtrend. Dipercaya bahwa indikator yang lebih andal saat harga dan indikator pergerakan itu paralel dan kurang dapat diandalkan ketika mereka berkonvergensi.

Indikator Parabolik
Rumusan Parabolic SAR (Perhitungan)
P(t) = P(t-1) + AF x (EP(t-1) – P(t-1)),

Di mana:
P(t) – nilai indikator sekarang;
P(t-1) – nilai pada periode yang sebelumnya;
AF – faktor akselerasi, umumnya naik dari 0.02 hingga 0.2 dengan langkah 0.02;
EP(t-1) – hagra ekstrem pada masa sebelumya.
Cara menggunakan Parabolik pada platform trading
Forex Indicators FAQ
What is a Forex Indicator?
Forex technical analysis indicators are regularly used by traders to predict price movements in the Foreign Exchange market and thus increase the likelihood of making money in the Forex market. Forex indicators actually take into account the price and volume of a particular trading instrument for further market forecasting.
What are the Best Technical Indicators?
Technical analysis, which is often included in various trading strategies, cannot be considered separately from technical indicators. Some indicators are rarely used, while others are almost irreplaceable for many traders. We highlighted 5 the most popular technical analysis indicators: Moving average (MA), Exponential moving average (EMA), Stochastic oscillator, Bollinger bands, Moving average convergence divergence (MACD).
How to Use Technical Indicators?
Trading strategies usually require multiple technical analysis indicators to increase forecast accuracy. Lagging technical indicators show past trends, while leading indicators predict upcoming moves. When selecting trading indicators, also consider different types of charting tools, such as volume, momentum, volatility and trend indicators.
Do Indicators Work in Forex?
There are 2 types of indicators: lagging and leading. Lagging indicators base on past movements and market reversals, and are more effective when markets are trending strongly. Leading indicators try to predict the price moves and reversals in the future, they are used commonly in range trading, and since they produce many false signals, they are not suitable for trend trading.
Gunakan indikator setelah mengunduh salah satu platform trading, yang ditawarkan oleh IFC Markets.
Pilihan Platform Perdagangan Terluas untuk Semua Perangkat

Not sure about your Forex skills level?
Take a Test and We Will Help You With The Rest


