- Edukasi
- Analisis teknis
- Indikator teknis
- Oscillator
- Indikator Stochastic
Stokastik - Indikator Stochastic
Apa itu Stochastic
Cara mengatur indikator Indikator Stochastic pada platform trading
Cara Menggunakan Stochastic
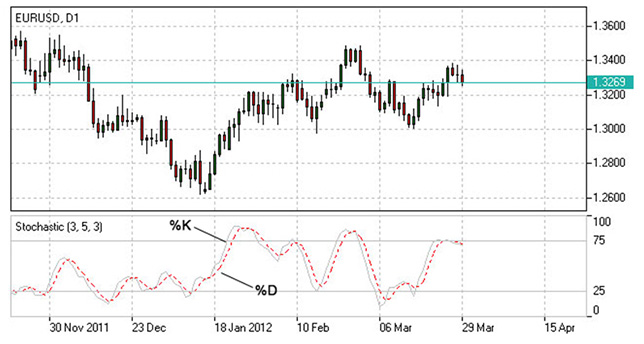
Indikator Stochastic memungkinkan untuk mengidentifikasi area overbought and oversold yang memungkinkan, tapi harus dipertimbangkan dalam analisis tren:
- Secara umum jika indikator naik di atas 75, aset dapat overbought;
- Jika indikator turun di bawah 25, aset dapat oversold.
Meninggalkan daerah ekstrim indikator mungkin menyarankan kemungkinan titik balik:
- Melintasi batas overbought dari atas, Stochastic memberikan sinyal kemungkinan peluang jual;
- Melintasi batas oversold dari bawah, Stochastic memberikan sinyal kemungkinan peluang beli.
Persilangan dari indikator dengan garis sinyal lurusnya, biasanya rata-rata pergerakan 3 periode, juga dapat mendeteksi peluang transaksi:
- Indikator menyarankan long ketika melintasi garis sinyal dari bawah;
- Indikator menyarankan short saat melintasi garis sinyal dari atas.
Pola konvergensi/divergensi dapat mengindikasikan kemungkinan kelemahan tren:
- Jika naik harga ke titik tinggi baru, tetapi indikator tidak, yang mungkin menjadi tanda kelemahan uptrend;
- Jika harga turun ke level terendah baru, tetapi indikator tidak, yang mungkin menjadi tanda kelemahan downtrend.

Stochastic Indicator
Strategi Trading Osilator Stokastik
Sistem stokastik berdasarkan pada pengamatan bahwa pada uptrend, harga penutupan cenderung mendekati ujung atas kisaran harga, dan pada downtrend harga penutupan cenderung berada di dekat ujung bawah kisaran harga.
Dalam strategi Stokastik dua garis – garis %K dan garis %D – digunakan. Garis K lebih cepat dan garis D lebih lambat. Garis ini berosilasi dari 0 hingga 100 pada skala vertikal. Sinyal utama untuk dipertimbangkan adalah divergensi antara garis D dan harga dari pasar. Ketika garis D melebihi 80 dan membentuk dua puncak turun dengan harga bergerak lebih tinggi, terjadilah divergensi bearish. Saat garis D di bawah 20 dan membentuk dua titik bawah yang naik dengan harga yang bergerak lebih rendah, terjadilah divergensi bullish. Untuk itu, sinyal beli dan jual dipicu saat garis K melintasi garis D. Sinyal jual dihasilkan saat garis A melintas di bawah garis D di atas level 80. Sehingga, sinyal beli dihasilkan saat garis A melintas di atas garis D dibawah level 20.
Stochastic Formula (Perhitungan)
Stokastik = 100 x ((C – L)/(H – L));
Sinyal = rata-rata tiga nilai terakhir Stokastik;

di mana:
C – harga tutup terbaru;
L – harga terendah pada jangka waktu yang ditentukan;
H – harga tertinggi pada jangka waktu yang ditentukan.
Forex Indicators FAQ
What is a Forex Indicator?
Forex technical analysis indicators are regularly used by traders to predict price movements in the Foreign Exchange market and thus increase the likelihood of making money in the Forex market. Forex indicators actually take into account the price and volume of a particular trading instrument for further market forecasting.
What are the Best Technical Indicators?
Technical analysis, which is often included in various trading strategies, cannot be considered separately from technical indicators. Some indicators are rarely used, while others are almost irreplaceable for many traders. We highlighted 5 the most popular technical analysis indicators: Moving average (MA), Exponential moving average (EMA), Stochastic oscillator, Bollinger bands, Moving average convergence divergence (MACD).
How to Use Technical Indicators?
Trading strategies usually require multiple technical analysis indicators to increase forecast accuracy. Lagging technical indicators show past trends, while leading indicators predict upcoming moves. When selecting trading indicators, also consider different types of charting tools, such as volume, momentum, volatility and trend indicators.
Do Indicators Work in Forex?
There are 2 types of indicators: lagging and leading. Lagging indicators base on past movements and market reversals, and are more effective when markets are trending strongly. Leading indicators try to predict the price moves and reversals in the future, they are used commonly in range trading, and since they produce many false signals, they are not suitable for trend trading.
Pilihan Platform Perdagangan Terluas untuk Semua Perangkat

Not sure about your Forex skills level?
Take a Test and We Will Help You With The Rest


